
Chewing Gum and Big Data
The year is 1974. “Hooked on a Feeling” is playing on the supermarket speakers, and you’re exhausted after barely sleeping; author Stephen King’s debut novel Carrie has resulted in you jumping at shadows. At the cash register, you pick up some chewing gum and the cashier unexpectedly shoots a hand-laser at a new technology, the barcode. Unbeknownst to you, this is one of the first steps in the complex story of how modern life became line items of actionable (and hackable) code.
Wrigley’s placed the first barcode on a consumable package – gum – in 1974, kicking off a wave of data gathering, usage and storage, empowering businesses to further understand their own operations in previously unavailable ways. The ramifications of these tiny black and white lines and numbers on packaging have revolutionized the relationship between business and consumers. This information allowed companies to effectively predict inventory movement (both storage and sales), which led to the development of industries like supply chain management and marketing analytics. Businesses had more power at their fingertips to better understand their consumers and combat the omni-present challenge of growth and sustainability. A major requirement for this to occur was for organizations to house and manipulate an ever-growing list of personal data points about their customers. The term “big data” comes from the concept of needing advanced analysis tools in order to leverage all this information.
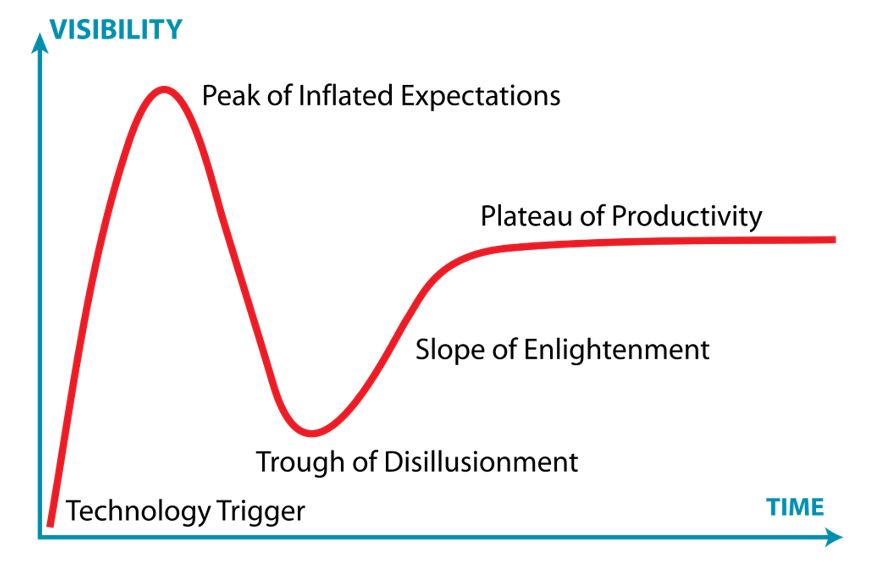
An interesting lens through which to view big data is the Gartner Hype Cycle (below), a tool that effectively illustrates the usage of a disruptive or innovative (frequently the same thing) product, technology or service.
The Hype Cycle Defined:
- Technology Trigger: First generation/iteration of technology/product/innovation becomes available
- Peak of Inflated Expectations: Various use-cases/success stories become available and widely written about and discussed in the marketplace
- Trough of Disillusionment: Examples of failure, misuse and misunderstanding of the technology/product comes to light
- Slope of Enlightenment: Second generation instances of usage become available and/or understood. Industry-at-large remains cautious, but innovators push forward
- Plateau of Productivity: Guidelines for usage are clearly defined and mainstream adoption/confidence occurs
In this example, the Technology Trigger would be the mass collection and usage of data by businesses and marketers.
Parallel to companies becoming sophisticated with data usage for back-end processes such as supply chain, marketers have been empowered to support the effort by leveraging data to more effectively build out communication strategies. How frequently is my target buying a product? What is the purchase cycle length, and is it in-store or online? All this information can be compiled and analyzed, and ultimately used to build a more informed and targeted messaging ecosystem. The backbone of more personalized messaging has been accomplished through a myriad of systems and tools, typically through first party (company’s data about their own clients) or third party (widely available data in the marketplace) data. Spending on targeting data globally reached 11.4 billion dollars in 2018; a staggering 72% increase from 2016. These efforts promote the ideal media channel mix that promotes the goal of the right impression in front of the right person, at the right time.
Much of what a person does in their daily life has been turned into a data point to be acted upon. Each device in a consumer’s day, from their streaming audio applications to the usage of their smart TVs, is an actionable data point that can be leveraged for targeting. Measuring foot-traffic to a store after seeing a specific advertisement on a billboard? No problem. Targeting specific floors in an office building to influence awareness for a product or service? Absolutely possible. If the data is available, there’s a way it can been monetized. The data economy is growing by leaps and bounds. Cisco Systems estimates the volume of data within data storage facilities worldwide will reach 403 exabytes by the year 2021. To put this into perspective, one exabyte equals one billion gigabytes (GB), and most smartphones on the market have a storage capacity of 64 to 128 GB. Within the Hype Cycle, the mass proliferation, monetization and usage of data would fall under Peak of Inflated Expectations.
With all this information out there about ourselves and each other, what about abuse?
News of major leaks, breaches and hacks of corporations or government entities have exposed the American public to the term “big data,” essentially causing the start of the Trough of Disillusionment. Advertisers and corporations are pushing for clarity. Apple CEO Tim Cook’s op-ed in Time Magazine this past January noted the need to address and understand the “shadow economy” that controls and monetizes data. In his words, companies “exist purely to collect and sell it [data] to yet another buyer.” Advertisers certainly have had success in leveraging targeted campaigns to impact their clients’ campaign goals, but a lack of transparency from many data sources are leaving marketers wary of certain shades of big data.
At the time of writing, the advertising industry (through the lens of big data) seems to be slowly emerging through the Trough of Disillusionment and is heading into the Slope of Enlightenment. This stage in the Hype Cycle seems to be coming through two key areas: governmental regulation and a hard look in the mirror from the industry-at-large.